Figure 11:
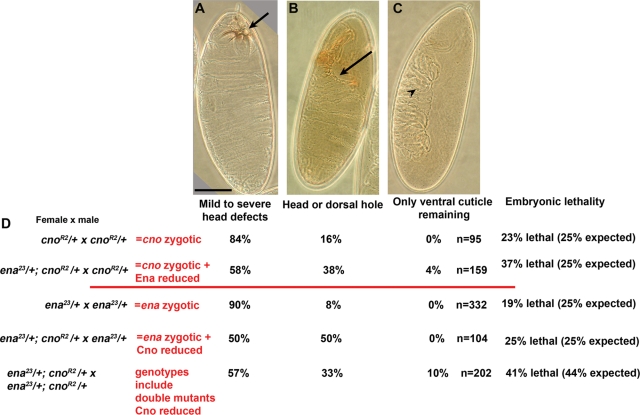
cno and ena exhibit strong, dose-sensitive genetic interactions. (A–C) Cuticles of embryos, exhibiting representative phenotypes scored in the different genotypes. (A) Example of mild to severe defects in the head skeleton (arrow), indicative of defects in head involution. (B) Example of the more severe phenotypic class, exhibiting either a head hole due to complete failure of head involution (arrow; illustrated here), a large dorsal hole, indicating failure of dorsal closure (not shown), or both. (C) Example of novel phenotypic class only seen in genetic interaction experiments, in which only the ventral cuticle (identified by the presence of denticle belts; arrowhead) remained. (D) Percentages of dead embryos in each phenotypic class for different genetic interaction crosses. Column at far right indicates embryonic lethality—expected percentages assume that only embryos homozygous for cno, ena, or both die. Scale bar, 75 μm.

