FIGURE 4:
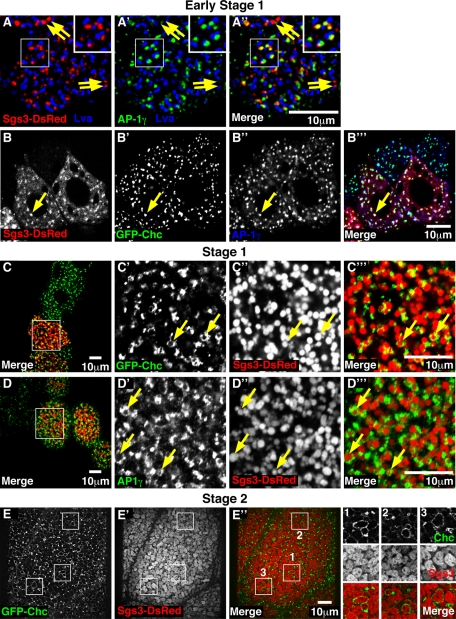
Sgs3-DsRed colocalizes with AP-1 and clathrin at the trans-Golgi network. Confocal fluorescence micrographs of third-instar salivary glands at the onset (early stage 1) (A–B’’’), stage 1 (C–D’’’), and stage 2 (E–E’’) of glue production. (A–A’’) Projections of a series of spinning-disk confocal images showing cells initiating Sgs3-DsRed (red) expression, stained with AP-1γ (green) and Lva (blue). In an early stage 1 cell, Sgs3-DsRed and AP-1γ partially colocalize (yellow) adjacent to the cis-Golgi marker Lva in a subset of Golgi bodies (A’’). Boxed region is shown at 2× higher magnification in the insets. Note that a subset of the Sgs3-DsRed puncta does not colocalize with AP-1γ (yellow arrows). Images were generated from a Z stack of five optical sections acquired at a distance of 0.3 μm. (B–B’’’) Sgs3-DsRed (red) partially colocalizes with both GFP-Chc (green) and AP-1γ (blue). Colocalization of Sgs3-DsRed with GFP-Chc and AP-1γ appears white in the merged image (B’’’). (C–C’’’) Low-magnification view of a portion of a salivary gland expressing GFP-Chc (green) and Sgs3-DsRed (red), showing a distal cell with a large number of stage 1 glue granules (C, boxed region; shown at higher magnification in C’–C’’’). GFP-Chc partially coats a subset of Sgs3-DsRed–containing stage 1 glue granules (C’–C’’’, yellow arrows). (D–D’’’) Low-magnification view of a portion of a salivary gland stained for AP-1γ (green) and expressing Sgs3-DsRed (red) reveals numerous cells with stage 1 granules (D; boxed region is shown at higher magnification in D’–D’’’). AP-1γ partially coats a subset of Sgs3-DsRed–containing granules (D’–D’’’, yellow arrows). (E–E’’’) Spinning-disk confocal micrographs of cells from a mature stage 2 salivary gland expressing GFP-Chc (green) and Sgs3-DsRed (red). GFP-Chc localizes near a broad range of Sgs3-DsRed–containing structures, including large stage 2 granules, as well as smaller vesicles (E’’). Boxed regions 1–3 in E’’ are shown at 2× higher magnification in the images on the right.

