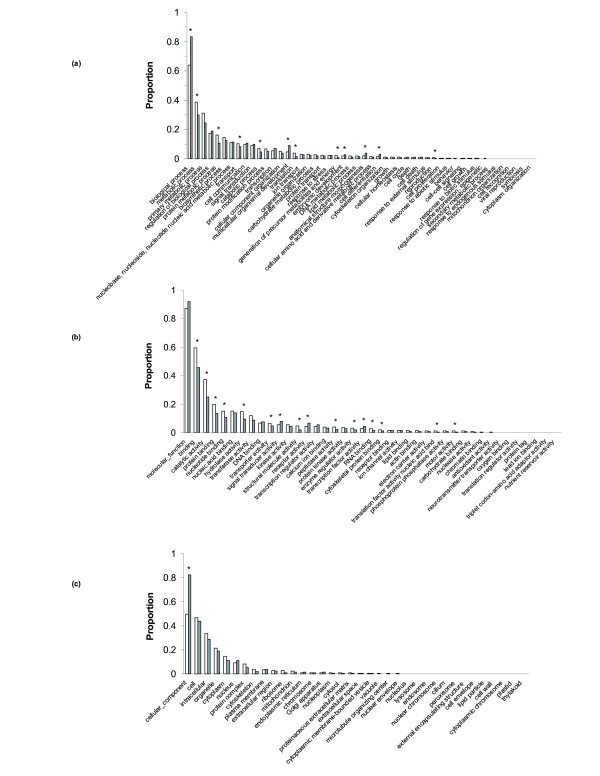
Figure 1.
Gene ontology (GO) ID representations for our guppy transcriptome database (white) and the zebrafish transcriptome (grey). Three comparisons are shown: (a) biological processes ontology; (b) molecular function ontology; (c) cellular component ontology. Asterisks denote significant differences between species for each category. Significance was determined via χ2 tests with a p-value corrected for multiple tests.

