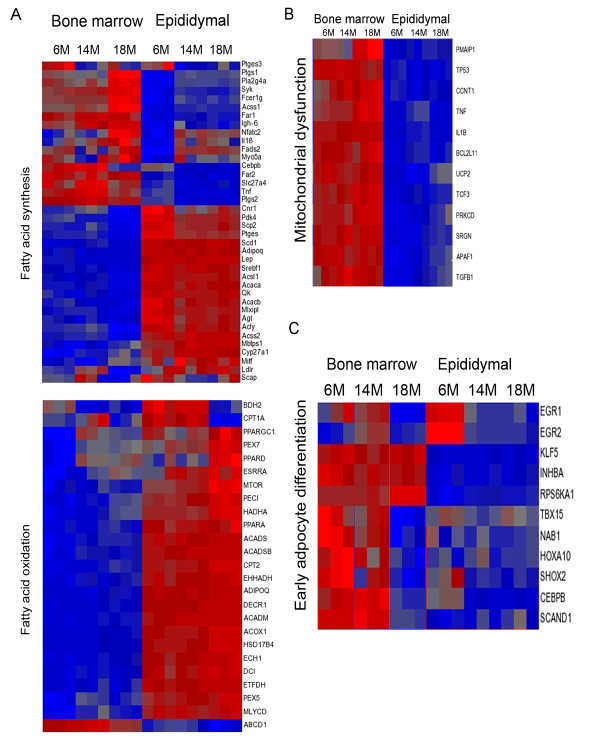
Figure 4.
Heat maps of genes differentially expressed in bone marrow adipocytes. A. Clustering of genes involved in lipid metabolism (fatty acid synthesis, upper panel, and fatty acid oxidation, lower panel) with at least a 2-fold difference between bone marrow adipocytes compared with epididymal adipocytes. B. Clustering of genes involved in decreased transmembrane potential of mitochondria with at least a 2-fold difference between bone marrow adipocytes compared with epididymal adipocytes. C. Clustering of genes involved in early adipocyte differentiation with at least a 2-fold difference between bone marrow adipocytes compared with epididymal adipocytes.

