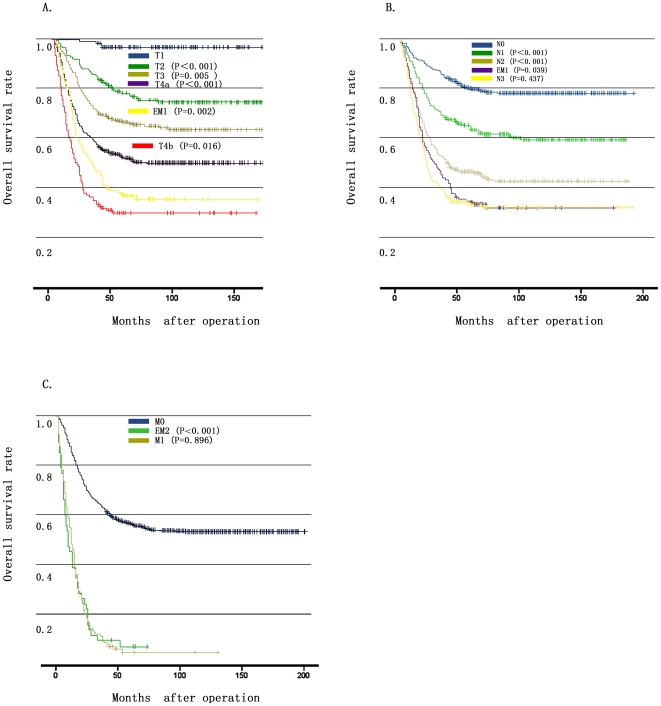
Figure 3. Comparison of survival curves between EMs and the T, N, M stages.
3A: Overall survival curves showed different outcomes among patients with T4a, EM1 and T4b (P = 0.002 and 0.016, respectively). 3B: Overall survival of patients with EM1 was worse than those of the N2 stage and was comparable to those of the N3 stage (P = 0.039 and 0.437, respectively). 3C: Patients with EM2 had a comparable overall survival with those of the M1 stage (P = 0.896).

