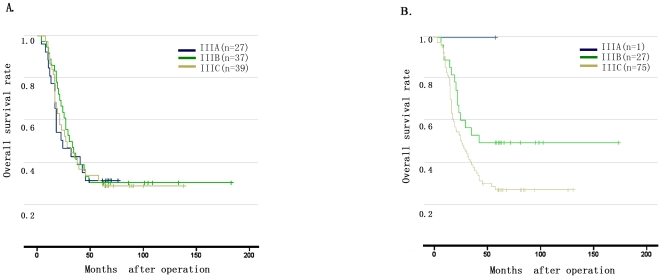
Figure 4. Comparison of survival curves among 103 cases of stage III patients with EM1 before and after consideration of EM1.
4A: Patients with EM1 had a comparable overall survival curves among each substage when EM1 was ignored (P = 0.991). 4B: Patients with EM1 had a distinguishable overall survival curves among each substage when with the consideration of EM1 as N3 stage (P = 0.023).

