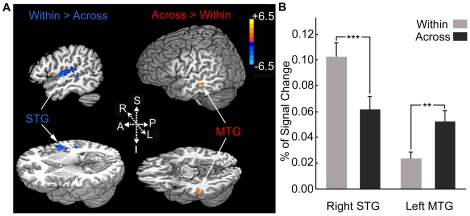
Figure 4. Activation in within-category deviant vs. across-category deviant contrast.
(A) Significant foci of activity for within-category deviant > across-category deviant (blue) and across-category deviant > within-category deviant (orange). (B) Mean percent BOLD signal change extracted from ROIs based on functionally defined activation clusters in the left mMTG (x = −53, y = −25, z = −10) and right lateral HG (x = 49, y = −9, z = 6). ** p<0.01, *** p<0.001.

