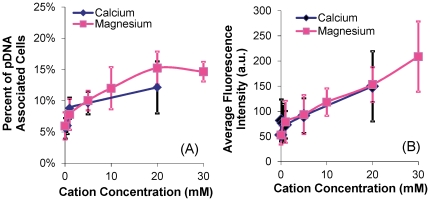
Figure 1. Dependence of membrane-bound pDNA on cation concentrations.
pDNA was labeled with YOYO-1 dye with basepair-to-dye ratio of 5∶1. The binding was characterized in terms of (A) percent of pDNA-associated cells and (B) average fluorescence intensity with arbitrary unit (a.u.) per pDNA-associated cell. The number of independent trials (n) was 5–6. The symbols and error bars denote means and standard deviations, respectively.

