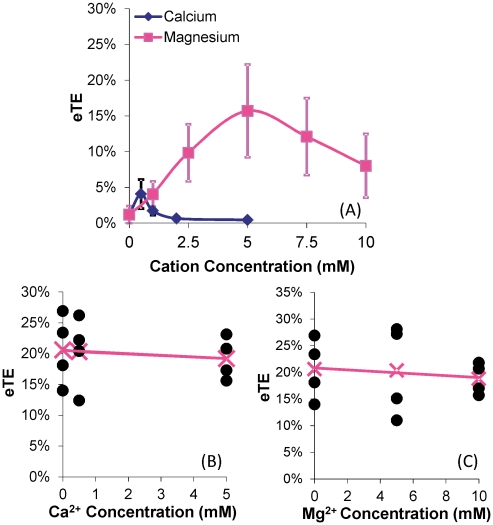
Figure 2. Dependence of electrotransfection efficiency on cation concentrations.
eTE is defined as the percent of live cells expressing GFP. B16-F10 cells were electrotransfected (400 V/cm, 5 msec, 8 pulses, 1 Hz) with unlabeled GFP-encoding pDNA in a transfection buffer. GFP expression was measured using flow cytometry after 24 hr incubation. (A) The low ionic strength medium supplemented with Ca2+ or Mg2+ at varying concentrations was used as the electrotransfection buffer. n = 7–8. The symbols and error bars denote means and standard deviations, respectively. The peak eTE value in each curve was significantly higher than those at both ends of the same curve (P<0.05). In Panels (B) and (C), OptiMEM was used as the electrotransfection buffer. After 20 min incubation post electrotransfection, the cells were re-suspended in the low ionic strength medium supplemented with either Ca2+ or Mg2+ at varying concentrations and treated again with the same electric field. The GFP expression was quantified at 24 hr. n = 4. The filled circles denote data from individual samples, the “x” symbol represents the mean of the samples at a given cation concentration, and the line represents the linear regression of the mean data. The mean value was statistically independent of the variation in Ca2+ and Mg2+ concentrations (P>0.05, Mann Whitney U test).

