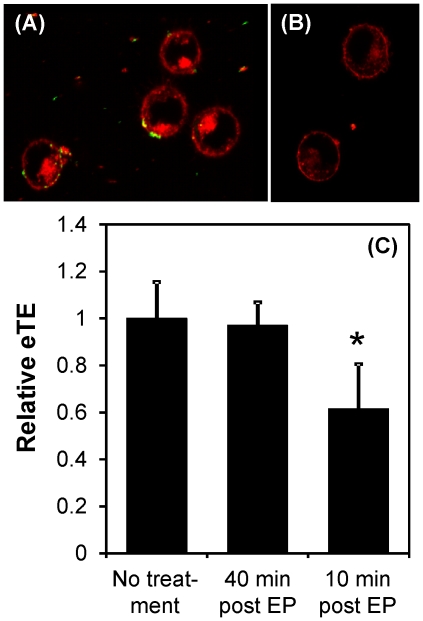
Figure 3. Effects of trypsin treatment on pDNA adsorption to cell membrane and eTE.
(A) YOYO 1-labeled pDNA (green) formed complexes with FM4-64FX labeled plasma membrane (red) following exposure of cells to pulsed electric field (400 V/cm, 5 msec, 8 pulses, 1 Hz). The image was taken shortly after the application of electric field. (B) The experimental protocol was the same as that in the Panel (A), except that at 10 min post electric field exposure, the cells were treated with 0.25% trypsin-EDTA solution for 30 min at 37°C. The image was taken after the trypsin treatment. (C) B16-F10 cells in pDNA solution were exposed to the same electric pulses (EP) as above. At 10 or 40 min post EP exposure, the cells were treated with 0.25% trypsin-EDTA for 30 min at 37°C. Then, the cells were cultured for 24 hr at 37°C. The eTE was measured as the percent of live cells expressing GFP and normalized by the data from the untreated group. The solid column and error bar represent mean and standard deviation of the relative eTE, respectively. n = 6–9. * P<0.05 (Mann-Whitney U test).

