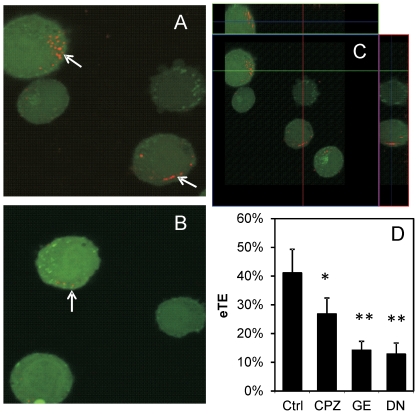
Figure 4. Reduction in cellular uptake of pDNA and the eTE by endocytic inhibitor treatment.
pDNA covalently labeled with rhodamine (red) was electrotransfected (400 V/cm, 5 msec, 8 pulses, 1 Hz) into cells pre-treated with (A) DMSO (drug vehicle) or (B) dynasore (80 µM) for 1 hr. After electrotransfection, the cells were incubated at 37°C to enable cellular uptake of pDNA for 30 min. At the end of incubation, the cells were examined using confocal microscopy. Arrows in the microscopic images denote pDNA internalized by cells. To visualize three-dimensional distribution of pDNA in the cytosol, two optical cross-sections of DMSO-treated cells in x–z and y–z planes are shown in Panel (C). Effects of endocytic inhibitor treatment on the eTE are shown in Panel (D). Cells were treated with DMSO (Ctrl), 28 µM CPZ, 200 µM genistein (GE), or 80 µM dynasore (DN) for 1 hr prior to electrotransfection with the GFP-encoding pDNA. The eTE, defined as the percent of live cells expressing GFP, was quantified after cells were cultured at 37°C for 24 hr. n = 4–6. * P<0.05 and ** P<0.005 (Mann-Whitney U test).

