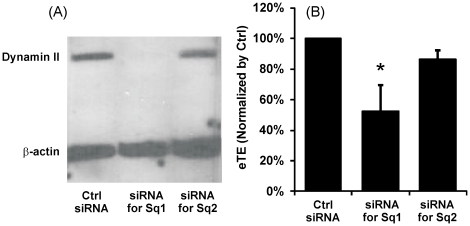
Figure 5. Effects of dynamin II knockdown on pDNA electrotransfection.
B16-F10 cells were transfected with either the control siRNA or one of the two specific siRNA oligos directed against two different sequences (i.e., Sq1 and Sq2) in mouse dynamin II gene for silencing its expression. The siRNA treatment was followed by a 48 hr incubation period prior to pDNA electrotransfection. Dynamin II and β-actin (loading control) expression levels in Western blot analysis are shown in Panel A and normalized electrotransfection efficiencies are shown in Panel B. The bars and error bars indicate the means and standard deviations of 4 independent trials, respectively. The data from each trial, used in mean and standard deviation calculation, was the average value of replicates or triplicates. *, P<0.05 (Mann-Whitney U test).

