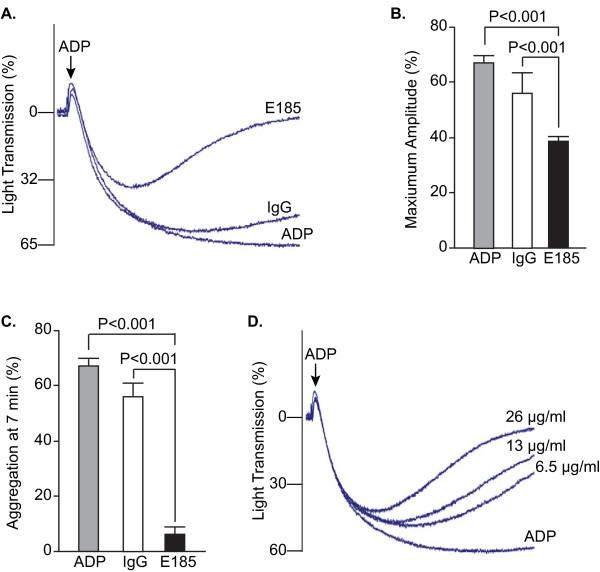
Figure 4.
EMILIN2 antibody inhibited mouse platelet aggregation. A, B, C. Platelet aggregation in platelet-rich plasma was induced by ADP and optically measured with an aggregometer. Platelets were pre-incubated with affinity purified rabbit anti-mouse EMILIN2 antibody (E185) or rabbit IgG as a control. A. Representative aggregation curves are shown. B. Quantification of aggregation results expressed as maximal amplitude of aggregation (mean ± SEM, n = 3-6). C. Quantification of platelet aggregation rate at 7 minutes after addition of ADP (mean ± SEM, n = 3-6). D. Representative platelet aggregation curves in platelet-rich plasma from B6-Chr17A/J mice. Concentrations of EMILIN2 antibody are indicated. Statistical differences between ADP or IgG and E185 were determined by ANOVA with a Newman-Kuels Multiple Comparison Test.

