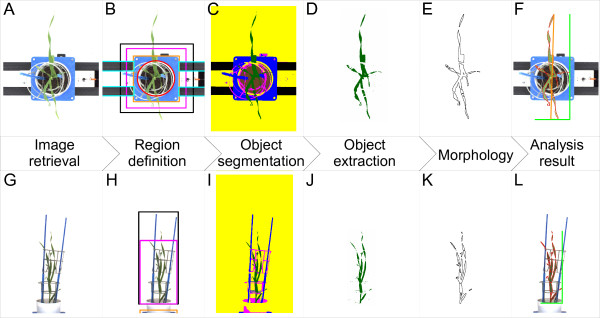
Figure 3.
High-throughput image analysis pipeline HTPheno for top view (A-F) and side view (G-L) images. From left to right: 1) retrieve images (A, G). 2) define regions for top view (B): region of soil (red circle), carrier (orange rectangle), cages (magenta rectangle), sticks (black rectangle) and conveyor belt (light blue rectangles) respectively side view (H): carrier (orange rectangle), cages (magenta rectangle) and sticks (black rectangle). 3) segment defined objects by colour segmentation (C, I): soil (brown), carrier and sticks (blue), cages (magenta), conveyor belt (black), background (yellow) and the plant (green). 4) Object extraction (D, J). 5) morphological opening (E, K). 6) analysis result (F, L) showing outline of plant (red), in top view x-extent, y-extent (light green), and diameter (orange) of plant, in side view width and height (light green) of plant.

