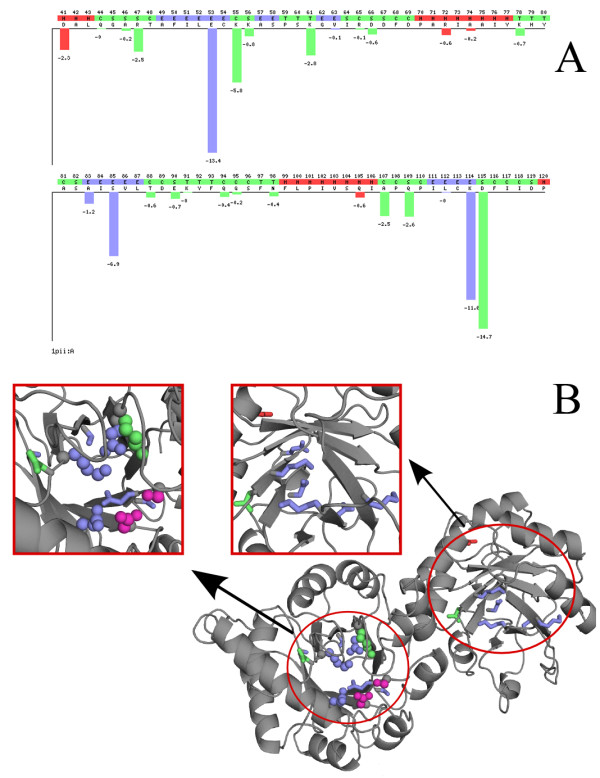
Figure 2.

Sequence optimality in the active site of the PRAI-IGPS enzyme. A. Sample output of the PoPMuSiC-2.1 web server, corresponding to residues 41-120 of the bifunctional enzyme PRAI:IGPS from E. Coli (PDB code: 1PIIpdb1PII). The sequence optimality score Γ is plotted as a function of the position in the sequence. The elements of secondary structure are distinguished by the associated colour: helices in red, strands in blue, and coils in green. B. Schematic representation of the PRAI:IGPS enzyme. The residues identified by PoPMuSiC as being non-optimal with respect to the stability (Γ ≤ -5 kcal/mol) are highlighted in red (helix), blue (beta strand), or green (coil region). The residues recorded as catalytic residues in the Catalytic Site Atlas are represented as spheres, while those identified by PoPMuSiC but not recorded in the Catalytic Site Atlas are represented as sticks. Catalytic residues that are not identified by PoPMuSiC are colored in magenta.
