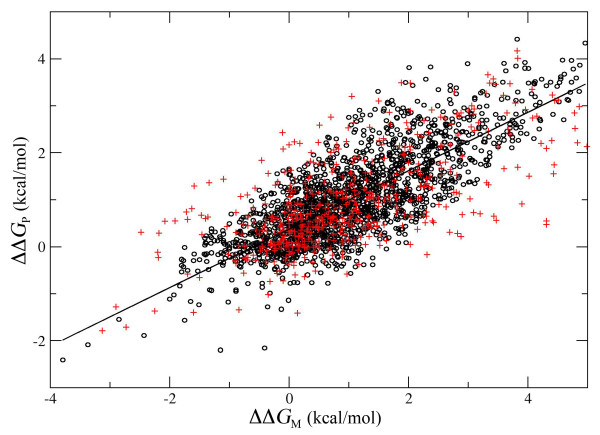
Figure 3.
The predicted stability changes (ΔΔGP) are plotted against the corresponding measured values (ΔΔGM) for the 2648 mutants of our dataset, after one of the 5 runs of cross-validation. Mutations belonging to the training set are depicted in black (o), while mutations belonging to the validation set are depicted in red (+).

