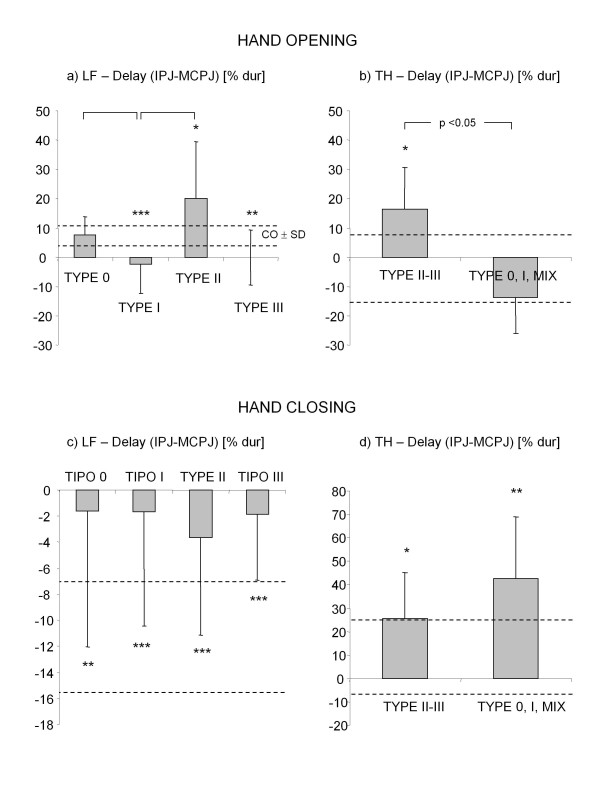
Figure 9.
Inter-joint coordination in stroke subjects. Delay between IPJ and MCPJ of thumb (TH) and long fingers (LF) for stroke subjects, during hand opening (a, b) and hand closing (c, d). Columns and whiskers represent mean and standard deviation, respectively. Dashed horizontal lines represent healthy control range (± SD). *p < 0.05, **p < 0.01, ***p < 0.001 (Stroke Type vs Control, Mann-Whitney U test). Significant differences among stroke types are shown.

