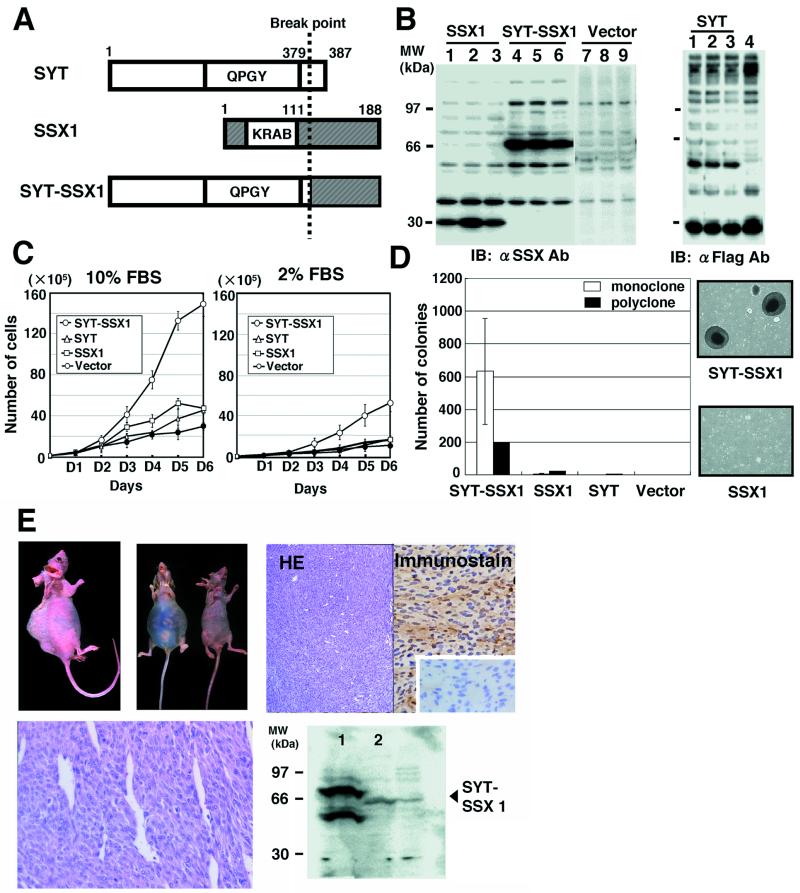
Figure 1.
Transforming activity of SYT-SSX1-expressing 3Y1 cells. (A) Schematic structure of the SYT, SSX1, and SYT-SSX1 proteins. The break point of chromosomal translocation for chimeric gene production is indicated by a broken line. (B) Stable expression of SSX1, SYT-SSX1, and SYT in 3Y1 cells. (Left) Expression levels of SSX1 (lane 1, clone F1–7; lane 2, F1–10; lane 3, F1–23) and of SYT-SSX1 (lane 4, Y1–8; lane 5, Y1–17; lane 6, Y1–24) and vector alone (lanes 7–9) analyzed by anti-SSX antibody. (Right) SYT expression (lane 1, clone SYT-1; lane 2, SYT-2; lane 3, SYT-4; lane 4, vector) by anti-Flag Ab. (C) Growth rates of each SSX1-, SYT-SSX1-, and SYT-expressing cell lines in culture with 10% (Left) and 2% (Right) serum. The averages of cell numbers of three independent clones were plotted and standard deviations are indicated as vertical bars. (D) Analysis of anchorage-independent growth of SYT-SSX1-expressing cells. The averages of colony numbers sized larger than 0.2 mm of three independent clones of each SSX1-, SYT-SSX1-, and SYT-expressing cells were plotted as open bar graphs with standard deviations indicated as vertical bars. SSX1, SYT-SSX1, and SYT-expression vectors were transfected to 3Y1 cells and after selected by G418, resistant clones were plated as polyclonal state, and the number of the formed colonies were measured. Photographs of representative colonies are shown on the right. (E) Tumor growth in nude mice. SYT-SSX1-expressing 3Y1 cells formed tumor masses at the back and in the peritoneal cavity of nude mice (Upper Left). Expression levels of SYT-SSX1 in formed tumors were confirmed by immunostaining (Upper Right) and immunoblotting (Lower Right). Microscopic appearance of tumors is shown by hematoxylin-eosin staining (Lower Left).

