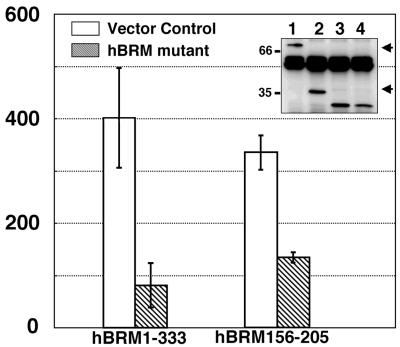
Figure 5.
Suppression of anchorage-independent growth of SYT-SSX1-expressing 3Y1 cells by dominant negative form of hBRM/hSNF2α. Either hBRM1–333 or hBRM156–205 was transfected in SYT-SSX1-expressing 3Y1 cells (clone Y1–17) together with pBabe-hygo; and after drug selection colony formation assay was performed. The average numbers of formed colonies are shown as bar graphs with standard deviation. The protein expression levels confirmed by immunoprecipitation and immunoblotting by using anti-HA are also displayed. Lane 1, hBRM1–333; lane 2, hBRM156–205; lane 3, HA-GFP as control for hBRM1–333; lane 4, HA-GFP as control for hBRM156–205. Arrowheads indicate two hBRM mutants.

