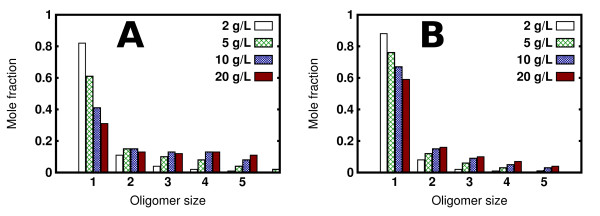
Figure 1.
Oligomerization of HFBI in aqueous solutions. Fractions of monomeric χ1 and higher oligomeric states χn observed in the simulations. Panel A refers to the simulations performed with 512 A chains while panel B shows the results for mixed chain (256 chain A + 256 chain B) simulations. Four different protein concentrations, indicated on the figure, were tested.

