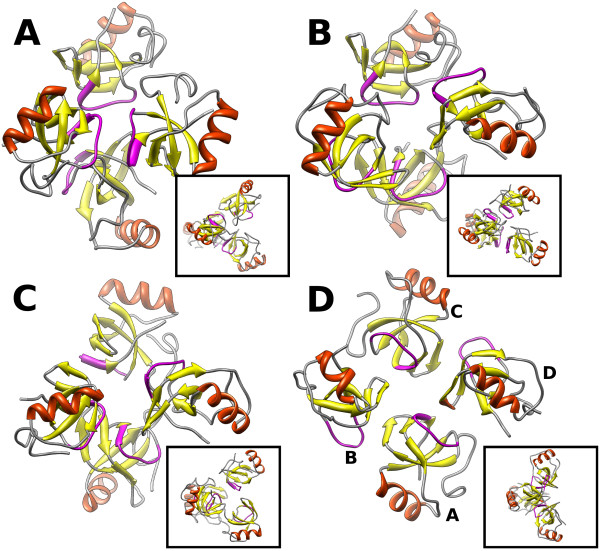
Figure 3.
Shape of the tetramers. Ribbon representation of the centroids of the first three most populated clusters (A, B, C) of encounter complexes obtained in the simulation at 5 g/L with only conformation A. In D, the ribbon trace of the crystal structure is shown. The insets show the corresponding structure rotated clockwise by 90° about the vertical axis. The loop 60-66, which plays an important role in tetramer formation, is shown in mauve.

