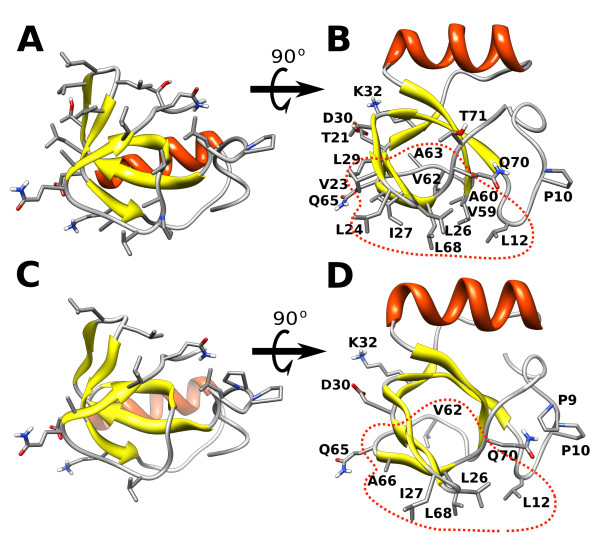
Figure 4.
The most frequently observed atomic contacts in the simulations. The residues with a contact probability larger than a defined threshold (see Methods Section) are shown for protein-protein (A, B) and protein-surface (C, D) contacts. A red dotted line is drawn around the residues which form the hydrophobic patch.

