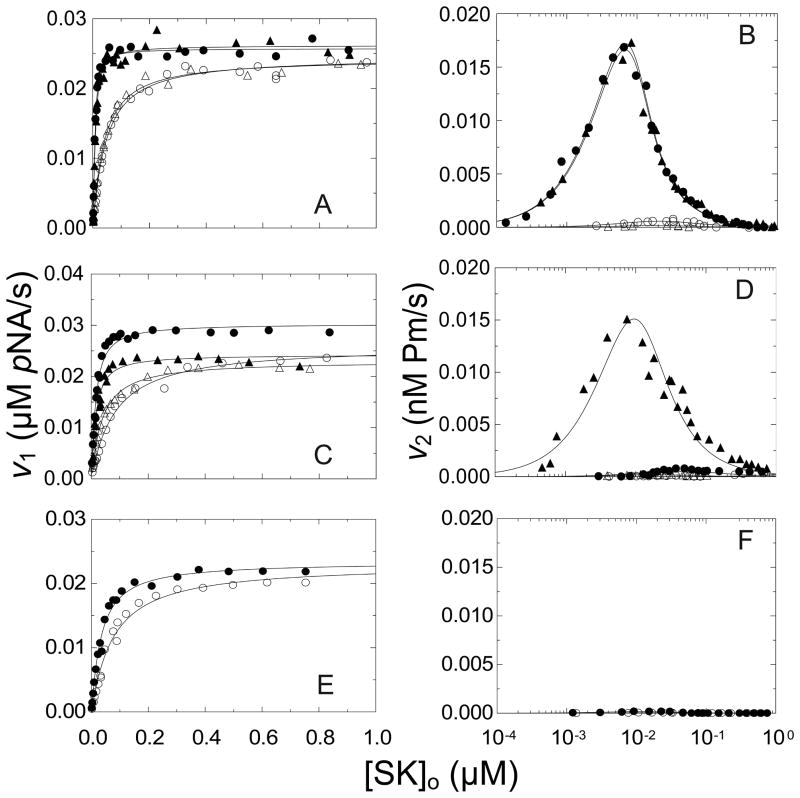
Figure 6. Steady-state kinetics of conformational and proteolytic [Lys]Pg activation by SK constructs.
A and B. v1 and v2, respectively, as a function of total SK concentration ([SK]o) for native SK (●) and wtSK (▲). C and D, v1 and v2, respectively, for SKΔ(R253-L260) (●) and wtSK-His6 (▲). E. and F., v1 and v2, respectively, for SKΔ(R253-L260))ΔK414-His6 (●). Experiments were performed in the absence solid symbols (●,▲) or presence open symbols (○,△) of 10 mM 6-AHA. The solid lines represent the fits of Eq 2 and 4 for v1, and Eq 3 and 4 for v2 in Materials and methods with the parameters listed in Table 2. Kinetics of 10 nM [Lys]Pg activation by SK constructs were performed and analyzed as described in Materials and methods.

