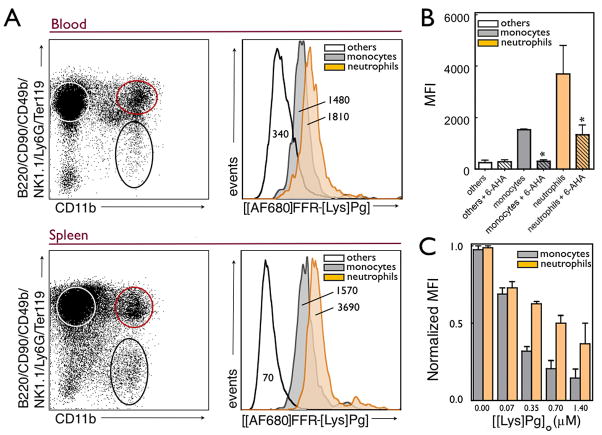
Figure 7. Application of the active site-labeling procedure to flow cytometry analysis of Pg receptors on immune cells visualized with [AlexaFluor 680]FFR-[Lys]Pg.
A, Representative flow cytometry dot plots collected from the blood (top) and spleen (bottom) from C57BL/6 mice (n=3). Populations of cells studied are highlighted with others cells (lymphocytes and red blood cells) denoted by the white circle, neutrophils (CD11b+ cells, but positive for B220/CD90/CD49b/NK1.1/Ly6G/Ter119 antibody cocktail) by the orange circle and monocytes (CD11b+ and B220/CD90/CD49b/NK1.1/Ly6G/Ter119 negative) by the black circle. Total [AF680]FFR-[Lys]Pg uptake for these same immune cell groups is shown as histograms with the MFI shown for each. B. [AF680]FFR-[Lys]Pg MFI compared among the same groups isolated from the spleen after incubation with or without 5 mM 6-AHA at 4 °C for 30 min. C. Binding of [AF680]FFR-[Lys]Pg to CD11b+ cells in the presence of increasing concentrations of [Lys]Pg. Results demonstrate the specificity of [AF680]FFR-[Lys]Pg labeling for labeling of neutrophils and monocytes. Experiments were performed in triplicate as described in Materials and methods, and standard error of the mean is shown. * indicates p < 0.05.

