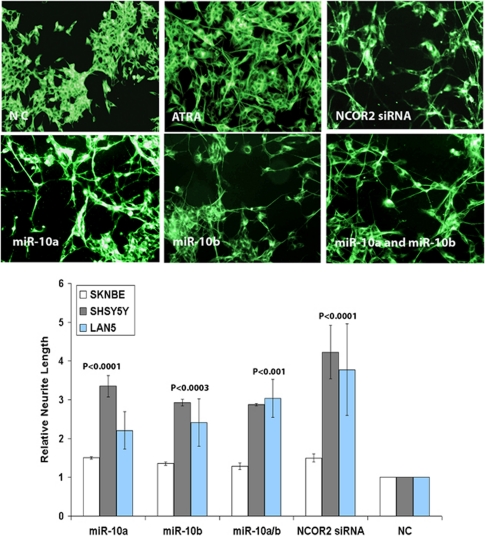
Figure 1.
Outgrowth of neurites in neuroblastoma cells. The upper panel shows morphology of SK-N-BE cells following transfections with a negative control (NC) oligonucleotide, treatment with ATRA, and transfections with either NCOR2 siRNA, miR-10a, miR-10b or miR-10a/10b combined. The lower panel displays a bar graph of neurite length measurements following ectopic overexpression of miR-10a, miR-10b, miR-10a+10b and siRNA-mediated knockdown of NCOR2 in SK-N-BE, SHSY-5Y and LAN5 cell lines at day 5 post transfection. All measurements are relative to the NC, a scrambled oligonucleotide (set as 1.0). All P-values are relative to NC and represent the minimum value for the three sets of cell lines

