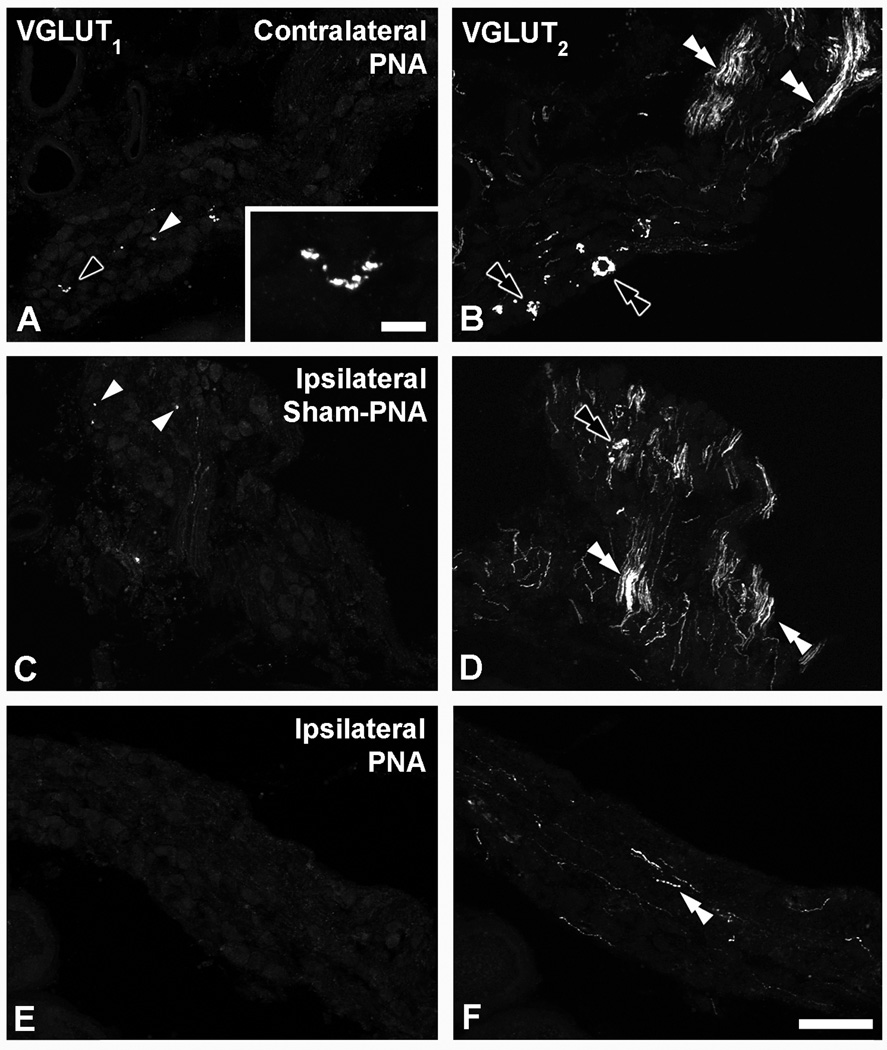
Figure 10.
Confocal immunofluorescence photomicrographs of sections from contralateral (A, B) or ipsilateral (C–F) MPGs after PNA (A, B, E, F) or sham-PNA (c, D), incubated with VGLUT1 (A, C, E) or VGLUT2 (B, D, F) antisera. White arrowheads in (A, C) show VGLUT1-IR varicosities (shown at higher magnification in inset (black arrowhead)). White or black double arrowheads show nerve fibers (B, D, F) or perineuronal baskets (B, D), respectively. Scale bars: 100 µm (A–F); 10 µm (inset in A).

