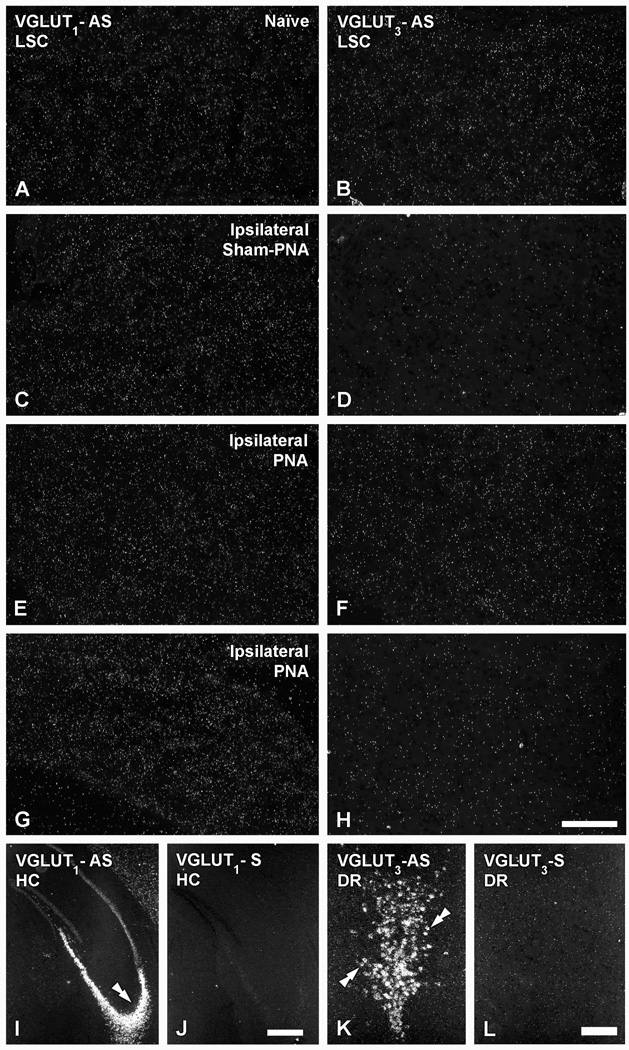
Figure 5.
Dark-field photomicrographs of LSC (A–H), the hippocampus (HC) (I, J) or the dorsal raphe nucleus (DR) (K, L), in naïve (A, B, I–L), ipsilateral sham-PNA (C, D), ipsilateral PNA (E, F) or ipsilateral SNA (G, H), after hybridization with antisense (A–H; I, K) and sense (J, L) riboprobes for VGLUT1 (A, C, E, G, I, J) or VGLUT3 (B, D, F, H, K, L) mRNAs. Double arrow in (I) and double arrows in (K) show mRNA labeling in the CA3 region of the HC or the DR, respectively. Scale bars: 50 µm (H=A–G); 200 µm (K, L); 500 µm (I, J).

