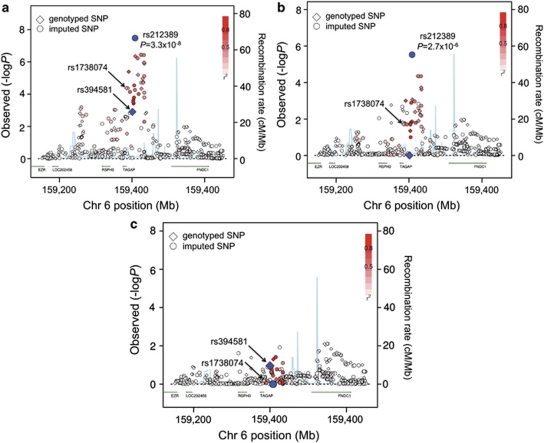
Figure 1.
TAGAP results from GWAS meta-analysis. (a) Results conditional only on the top five principal components (PCs). (b) Results conditional on previous RA SNP, rs394581 (in addition to five PCs). (c) Results conditional on new RA SNP, rs212389 (in addition to five PCs). In each plot, genotyped SNPs (diamonds) and imputed SNPs (circles) are shown across a 500-kb window, where the color of the symbol indicates LD (as measured by r2) to the new RA SNP (rs212389). Two genes, TAGAP and RSPH3, map within the recombination hotspots (shown in blue); three other genes map to the region (EZR, OSTCL/LOC202459 and FNDC1).

