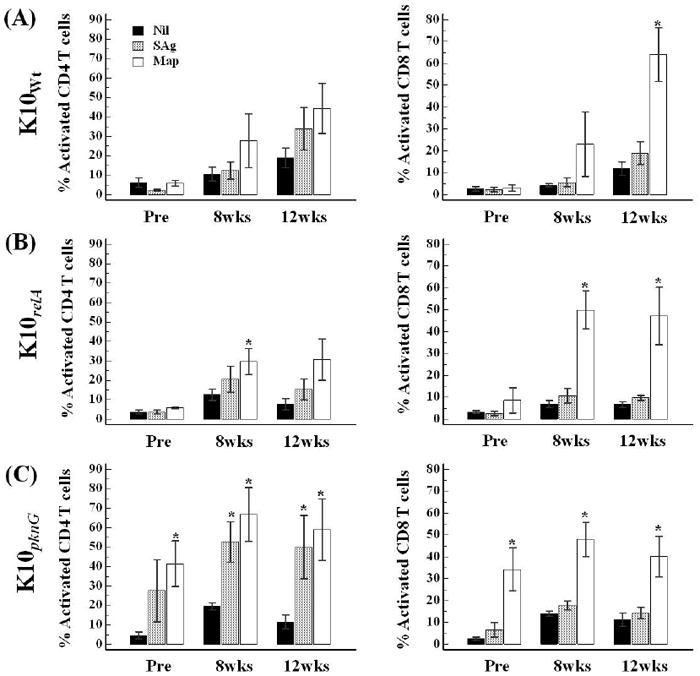
FIG. 4.

Comparison of memory T cell response in PBMCs isolated before and after infection by flow cytometric analysis. The data are presented as the mean percent (with SE) of activated CD4 or CD8 memory T cells in response to Map antigen stimulation or nil treatment at different time points. Pre, pre-infection; Nil, nil-stimulation; SAg, soluble anigen stimulation; Map, live Map stimulation; *, significant difference compared to the value of nil control (P < 0.05).
