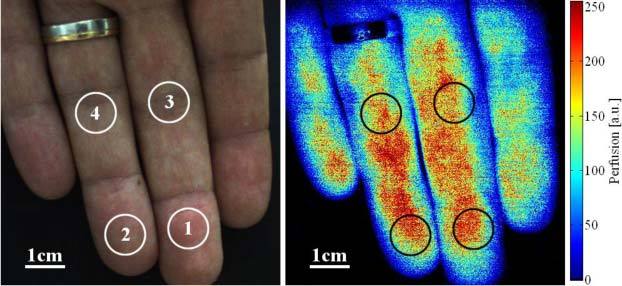
Fig. 2.

Color image of fingertips and color-coded blood perfusion map. (Media 1 (9.9MB, AVI) : captured video sequences showing the start of the arterial occlusion and the overshoot after release. The video frames were resized to 50% of the captured images to reduce the file size.)
