
Fig. 2.
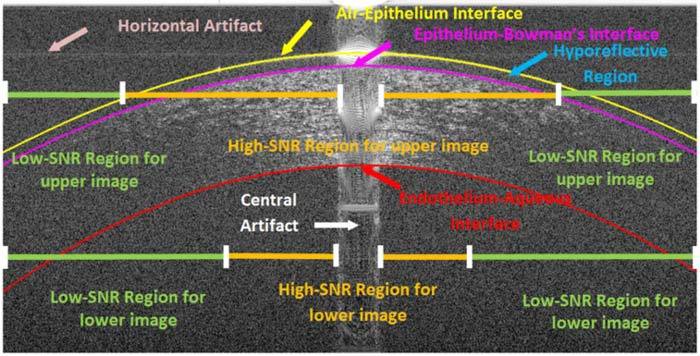
An example low-SNR corneal image (same OCT data as in Fig. 1.c) in which key regions and different types of imaging artifacts are labeled. Since SNR decreases with depth in SDOCT images, the regions of high and low-SNR also change. Some features, such as the hyporeflective region, appear in only a small subset of our corneal image database.