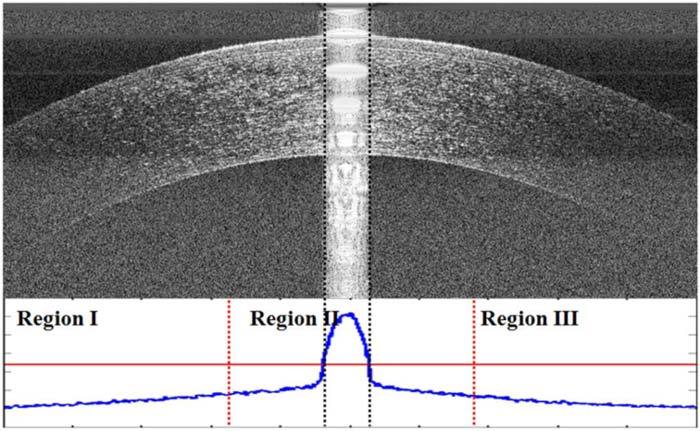
Fig. 6.

Comparison of A-scan mean intensities to detect the central artifact in Fig. 1.b. The plot below the image shows the A-scan mean intensities of the image with the different regions denoted by red, dotted vertical lines. The horizontal red line is 4/3 times the mean value of the mean intensity per A-scan in Regions I and III (the vertical axis on the bottom plot does not start at zero). The black dotted lines denote the central artifact as detected by our algorithm.
