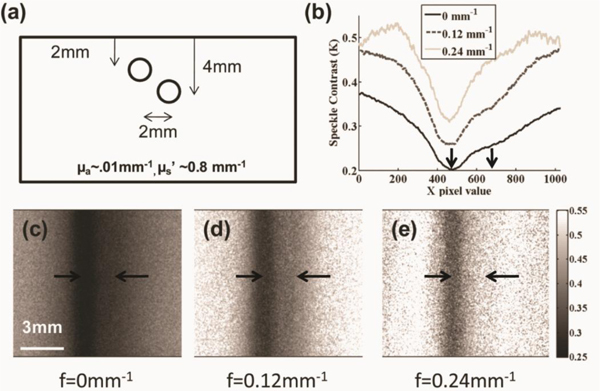
Fig. 2.

Spatial frequency depth speckle contrast maps. (a) A PDMS phantom with two tubes separated by 2 mm and buried 2 mm and 4 mm below the surface was fabricated, (b) Horizontal line profiles of (c-e) demodulated maps at three spatial frequencies shows increased sensitivity to 2 mm superficial tube flow (centered at left arrow) compared to 4 mm deep flow (centered at right arrow) as spatial frequency increases.
