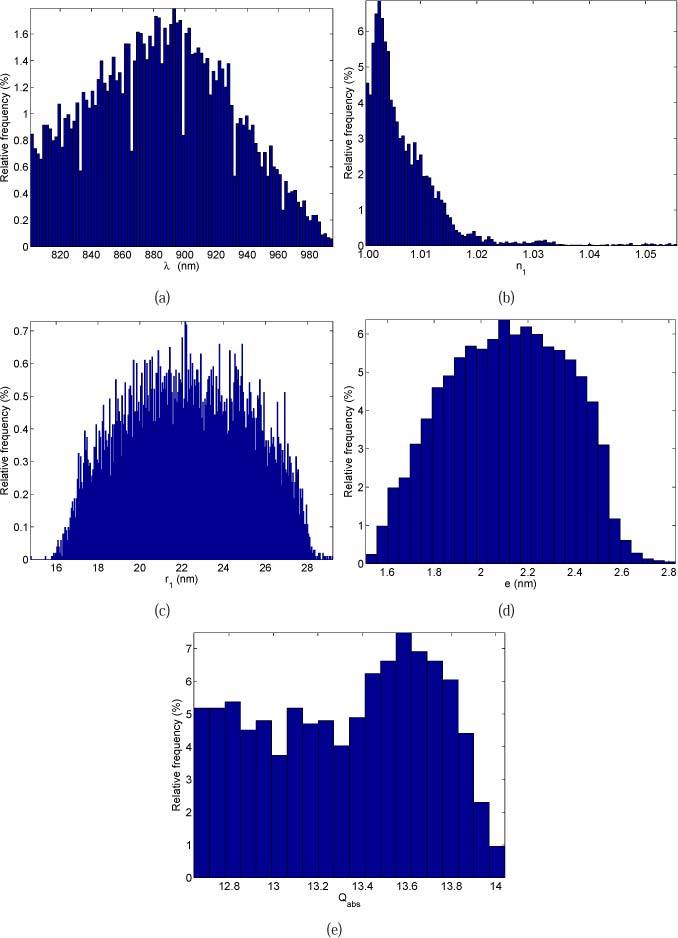
Fig. 3.

Histograms of (a) the wavelength, (b) the optical index of the core ( ) (c) the radius of the core, (d) the thickness of the shell, (e) the absorption efficiency. The relative frequency is plotted in percents, and the number of class is deduced from the uncertainty in Table 3, except for the absorption efficiency where the size of each class is fixed to 0.5%maxNM(Qabs).
