
Fig. 3.
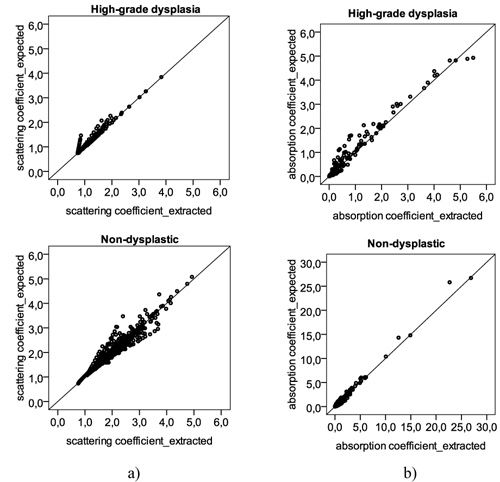
Scatter plots with the (a) reduced scattering coefficient and (b) absorption coefficient, determined for several different wavelengths: 350, 370, 380, 400, 420, 450, 480, 510, 540, 560, 580, 600, 620, 650, 700, and 750 nm. For each of these wavelengths, a different coefficient will be determined in each tissue site: a total of 10 high-grade dysplastic tissue sites and 53 non-dysplastic tissue sites were used, corresponding to 160 (10 times 16) and 848 (53 times 16) different values of reduced scattering and absorption coefficient. Y-axis represents the values of the coefficients extracted with the original spectrum; X-axis represents the values of the coefficients determined with the reconstructed spectrum, using only 16 points. The 45 degree black line represents a perfect agreement between the expected values, from the original spectrum, and the extracted values, from the reconstructed spectrum.