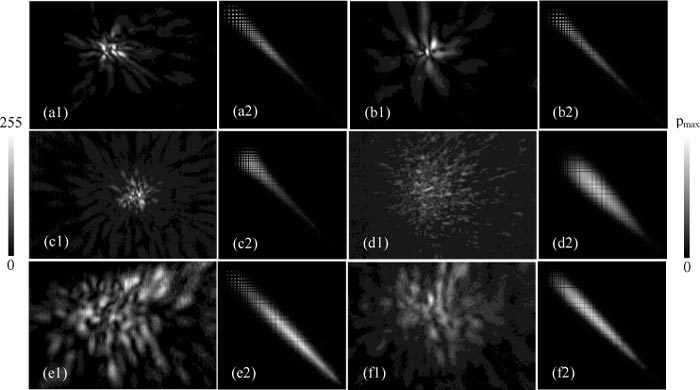
Fig. 2.

Typical pairs of measured diffraction images (1) and intensified GLCM images (2) of single flowing cells acquired at λ = 532nm: (a1/a2) Jurkat; (b1/b2) NALM-6; (c1/c2) U937; (d1/d2) MCF-7; (e1/e2) B16F10; (f1/f2) TRAMP-C1. The GLCM images are placed to the right of the diffraction images respectively. The scale bar on the left indicates the pixel values of the normalized diffraction images after conversion to 8-bit pixel values and the one on the right indicates the values of GLCM elements with pmax = (a2) 0.0172; (b2) 0.0204; (c2) 0.0160; (d2) 0.00302; (e2) 0.00175; (f2) 0.00297.
