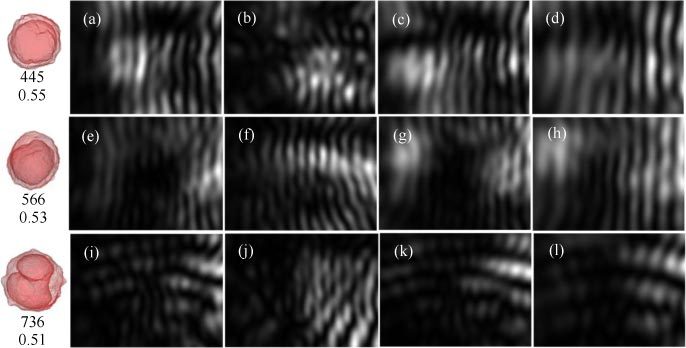
Fig. 4.

Simulated diffraction images with 3 reconstructed NALM-6 cell models: top row from (a) to (d): Cell #1; middle row from (e) to (h): Cell #8; bottom row from (i) to (l): Cell #9. All cells have the same index of refraction as nh = 1.33 for host medium and nc = 1.368 for cytoplasm. The column of (a), (e) and (i) are for cells of orientation along the z-axis or C(θ0 = 0, ϕ0 = 0) and nc = 1.45 for the nucleus; the column of (b), (f) and (j) are for cells of C(θ0 = 109°, ϕ0 = 118°) and nc = 1.45; the column of (c), (g) and (k) are for cells of C(θ0 = 0, ϕ0 = 0) and nc = 1.50; the column of (d), (h) and (l) are for cells of C(θ0 = 0, ϕ0 = 0) and nc = 1.50 with cell and nuclear volumes proportionally reduced to half. The left most column shows the projection images of #1, #8 and #9 cell models from top to bottom with the two numbers denoting the total cell volume in μm3 and volume ratio of nucleus to cell respectively.
