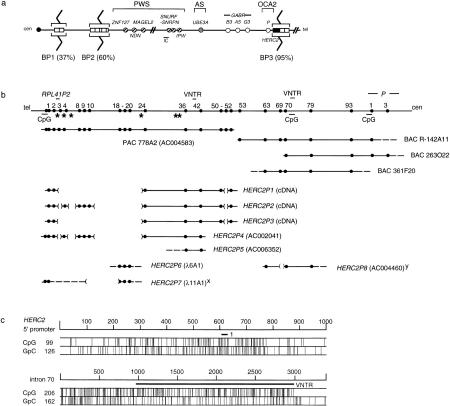
Figure 1.
Genomic characterization of HERC2 and partially duplicated paralogs. (a) Model showing the position of HERC2-containing duplicons (□; HERC2, █) in chromosomes 15q11 and 15q13. These map close to or within breakpoint 2 (BP2) and BP3, whereas those shown hypothetically at BP1 are only known to map centromeric of BP2 (Amos-Landgraf et al. 1999). The frequency (%) of breakpoints (zigzag lines) at each location is shown. PWS, AS, and OCA2 are the three known disease loci in 15q11–q13 (Nicholls et al. 1998). Other symbols: (cen) centromere; (circles) genes [(hatched) paternal only; (open) nonimprinted; (shaded) maternal only]; (IC) imprinting center; (tel) telomere. (b) Genomic map with PAC/BAC clone contig of the HERC2 locus and comparison to eight of the duplicated loci. Numbers at top correspond to exon numbers of HERC2 (several exons of the flanking P gene, two VNTRs, and the RPL41P2 gene are also shown). (CpG) CpG islands; (*) simple repeats of five or more copies in 5′ HERC2 (see Table 1). Broken lines represent an unknown extent for that particular end of a clone; parentheses [( )] represent genomic deletions of HERC2 in each duplicon. (x) Intron 9 and exon 18 are joined together in this clone; (y) sequence homologous to intron 55 was also identified 7 kb 5′ of exon 63 homologous sequence in this clone. (c) CpG content of the HERC2 5′ promoter region (nucleotide 4101–5100 of PAC 778A2 sequence) and CpG island upstream and spanning the intron 70 VNTR. Exon 1 and the intron 70 putative VNTR are shown as bars.

