Figure 1.
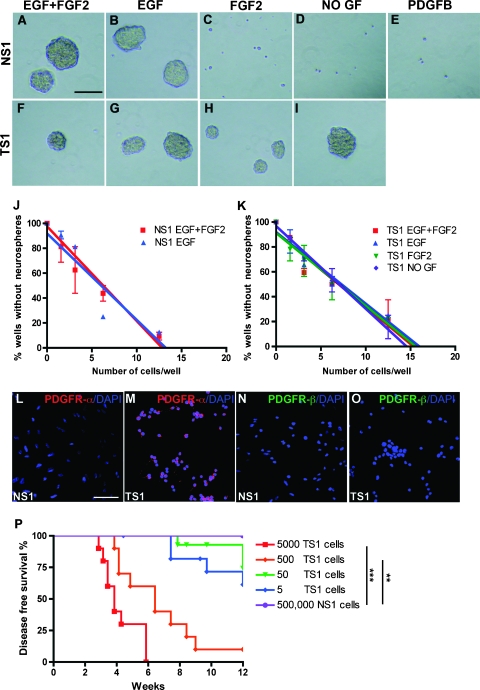
Self-renewal, stem cell frequency, and tumorigenicity of glioma-derived tumor sphere cells. (A–I) Sphere-forming assay showing the ability of NSCs (A–E; NS1 cells) and TS1 (F–I) cells to generate spheres in GIC medium containing different combinations of growth factors. Scale bar, 50 µm. (J–K) The result from the limiting dilution assay showing linear regression curves to determine the stem cell frequency in NS1 (J) and TS1 (K) cells. The experiments were repeated twice. (L–O) Immunofluorescence staining for PDGFR-α and PDGFR-β in NS1 and TS1 cells. Scale bar, 50 µm. (P) Kaplan-Meier graph showing survival of Gtv-a Arf-/- mice orthotopically transplanted with 5000, 500, 50, or 5 TS1 cells or 500,000 NS1 cells. Log-rank test, **P < 0.01, ***P < 0.001.

