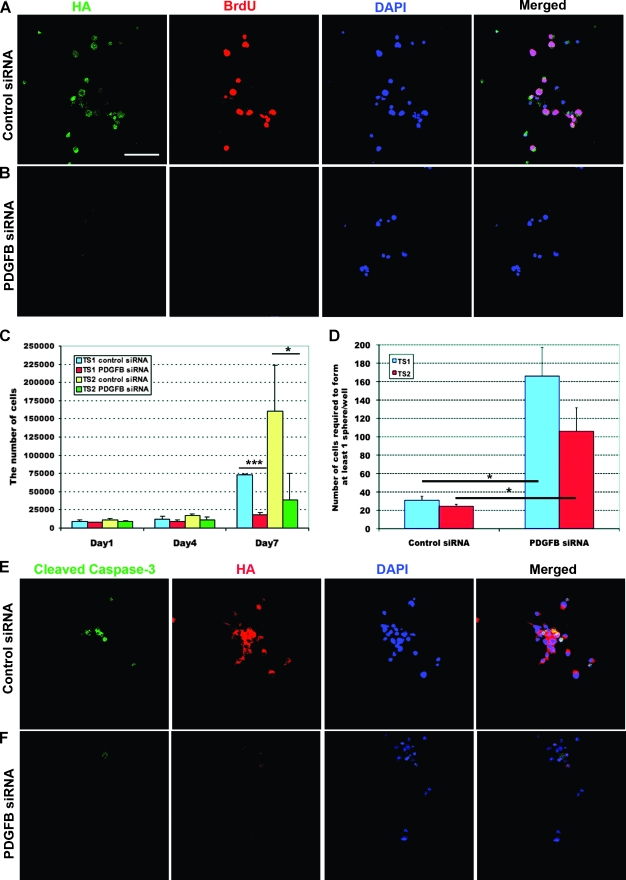
Figure 5.
Analysis of self-renewal, proliferation, and apoptosis on PDGF-B knockdown in GICs. (A–B) Expression of HA and Brdu in TS1 cells transfected with control (A) or PDGF-B (B) siRNA. (C) Total number of GICs after siRNA treatment. The experiment was repeated three times. Values represent the mean ± SD. Student's t test, *P < 0.05, ***P < 0.001. (D) Stem cell frequency in GICs after the siRNA treatment. The experiment was repeated three times. Values represent the mean ± SD. Student's t test, *P < 0.05. (E–F) Expression of cleaved Caspase-3 in TS1 cells treated with control (E) or PDGF-B (F) siRNA. Scale bar, 50 µm.

