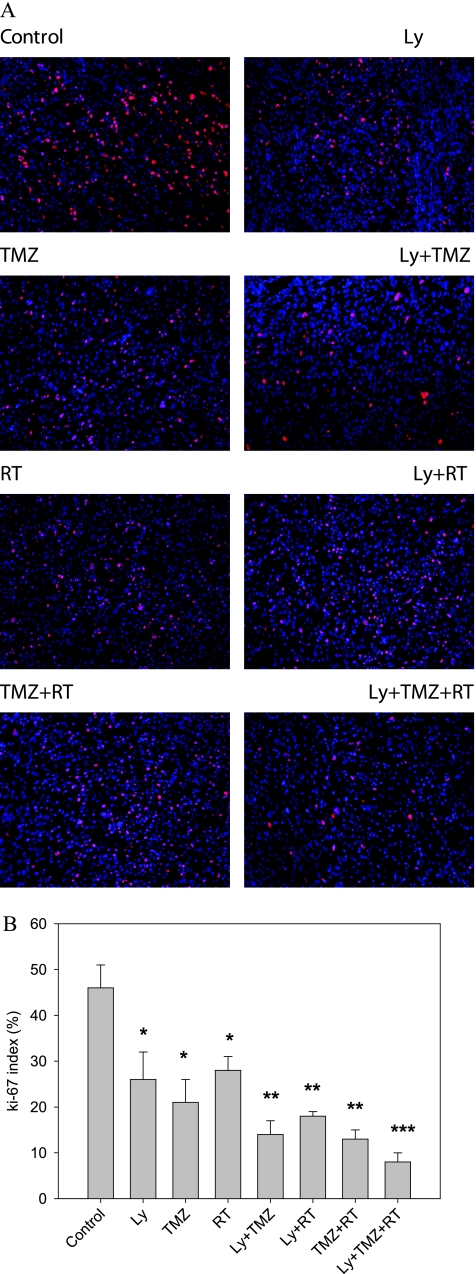
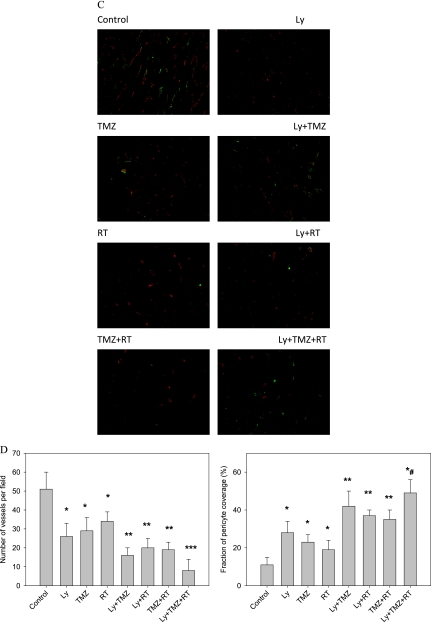
Figure 6.
Immunohistochemical evaluation of each treatment on the proliferation and intratumoral vasculature within U87MG xenografts. Tumor-bearing mice were killed on days 14 after the start of treatment (three animals per group). Tumors were excised and processed as described in Materials and Methods. (A) Representative examples for the detection of Ki-67 in tumor sections from various treatment groups (200x). (B) Quantitative comparison of the Ki-67 index in the tumor sections from the eight groups of animals. (C) Representative examples for the double staining of CD31/α-SMA (red, CD31; green, α-SMA) in tumor sections from various treatment groups. Original magnification, x200. (D) Quantitative comparison of tumor vessel (left panel) and fraction of pericyte coverage (right panel) in the tumor sections from the eight groups of animals. *P < .05 versus control. **P < .05 versus control and respective single treatment. ***P < .05 versus all other treatments. *#P < .05 versus Ly + RT and TMZ + RT but nonsignificant versus Ly + TMZ. Bars indicate SD; columns, mean.


