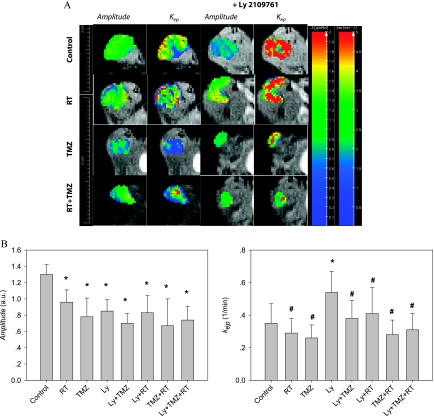
Figure 7.
MRI with amplitude and kep parameters of U87MG tumors under different treatments. Three tumor-bearing mice from each group were subjected to DCE-MRI measurement on day 14 before histologic examination. Amplitudes and kep were measured in regions of interest covering the total tumor. (A) Representative examples of color-coded amplitude and kep parameter maps from different treatment groups. (B) Quantitative comparison of the amplitude (left panel) and kep (right panel) parameter of the tumor from the eight groups of animals. Bars indicate SD; columns, mean; Ly, LY2109761; RT, radiation; TMZ, temozolomide. *P < .05 versus control. #Non-significant (P > .05) versus control.

