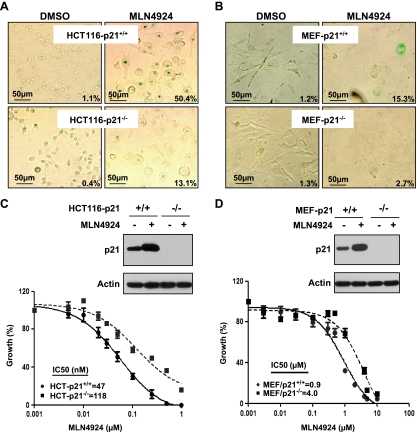
Figure 4.
MLN4924-induced senescence is p21 dependent. Cells were treated with MLN4924 at 0.1 µM (HCT116; A) or 1.0 µM (MEFs; B) for 80 hours, followed by SA-β-Gal staining. The percentage of cell population undergoing senescence were quantified by counting blue cells out of total cells in four to five independent areas. Shown is percent β-Gal-positive cells averaged from two independent experiments. Photographs were taken using Olympus DP70 camera (x200) with size bar shown. P < 0.01 by Student's t test between paired p21+/+ and p21-/- cells in both HCT116 and MEFs on MLN4924 treatment. Paired HCT116 cells (p21+/+ vs p21-/-) (C) or MEF cells (p21+/+ vs p21-/-) (D) were treated with MLN4924 at 0.1 or 1.0 µM for 80 hours, respectively, followed by immunoblot analysis (top), or with MLN4924 at various concentrations for 72 hours, followed by ATPlite assay. Shown is mean ± SEM from two independent experiments (bottom).

