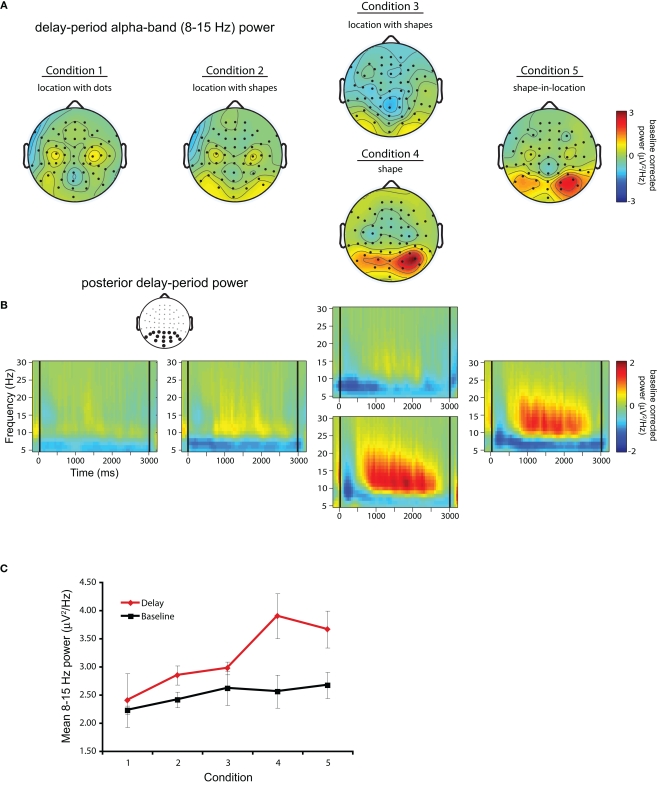
Figure 3.
Delay-period alpha-band power. (A) Topographical plots of mean power in the 8- to 15-Hz frequency band averaged over the 500- to 2500-ms portion of the delay across each block/condition. (B) Time–frequency plots for each trial block across the full delay period (delay marked by black lines at 0 and 3000 ms) in the 5- to 30-Hz frequency range for the cluster of posterior electrodes highlighted in black in the inset topographical plot. (C) Comparison of uncorrected mean alpha-band power during the baseline interval (black solid line) and the delay period (red solid line).

