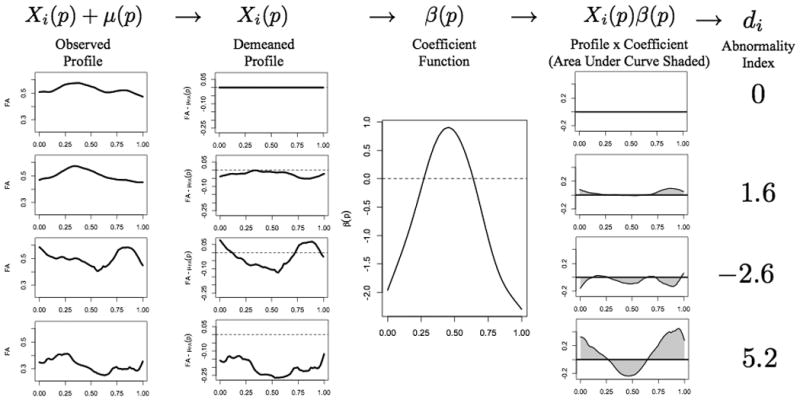
Figure 1.

Schematic description of the PFR analysis, using FA in the right OR as the regressor and case status as the outcome. In all panels, the horizontal axis corresponds to normalized position along the tract (0 is close to the lateral geniculate nucleus, 1 to the primary visual cortex), and the vertical axis is dimensionless. The left column shows raw tract profiles: top row, population mean FA derived from 42 healthy volunteers; second row, population mean derived from 115 MS cases; third row, 23-year-old healthy woman; fourth row, 42-year-old woman with secondary-progressive multiple sclerosis and EDSS 2.0. The second column shows the same tract profiles after subtracting the healthy-volunteer population mean. The third column shows the derived weighting function β(p) for this tract and MRI index. The fourth column shows the weighted tract profiles derived by point-wise multiplication of the demeaned tract profiles in the second column by the weighting function in the third column. Finally, the fifth column shows the tract-abnormality indices di. Lower (including negative) values of di denote tracts that are more likely to come from healthy volunteers, and higher values denote tracts that are more likely to come from MS cases. Thus, the tract in the fourth row, which derives from the MS case, is most abnormal.
