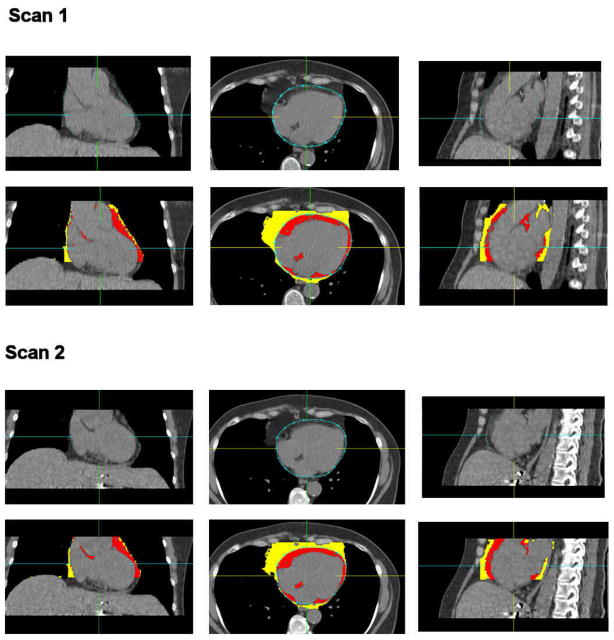
Figure 3.
Case example showing the epicardial fat measurements from an initial EBCT scan (scan1) followed by a MDCT scan (scan2) in a 61-year old woman with a BMI of 26.9. Coronal, transverse and sagital slices from the non-contrast CT scan are shown in top panel. Results of epicardial fat quantification are shown in 2nd panel. Red overlay represents epicardial fat enclosed by the pericardium. Yellow overlay represents thoracic fat outside the pericardium. EFVs were 112 cm3 and 109 cm3 and TFVs were 256 cm3 and 236 cm3 for the EBCT and MDCT, respectively.

