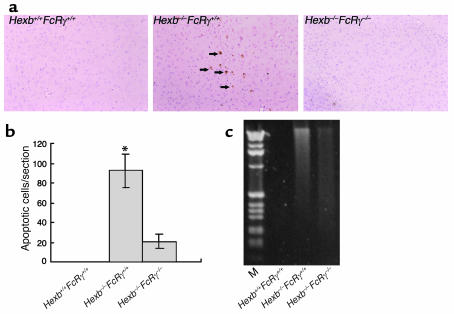
Figure 8.
Reduction of apoptosis in the brain of Hexb–/–FcRγ–/– mice. (a) At 14 weeks, Hexb–/–FcRγ–/– mice were analyzed by in situ TUNEL analysis, and compared with Hexb–/–FcRγ+/+ and Hexb+/+FcRγ+/+ mice. Arrows indicate apoptotic cells. Original magnification, ×100 (thalamus). (b) Numbers of apoptotic (TUNEL positive) cells were counted in a sagittal section of the brain. Data are mean ± SEM (n = 4). *P < 0.001, Student’s t test. (c) DNA laddering in the brain from Hexb+/+FcRγ+/+, Hexb–/–FcRγ–/–, and Hexb–/–FcRγ+/+ mice. One microgram of brain DNA was subjected to electrophoresis on a 2% agarose gel and stained with ethidium bromide. The lane at the left of the panel shows a 1-kb DNA ladder.

