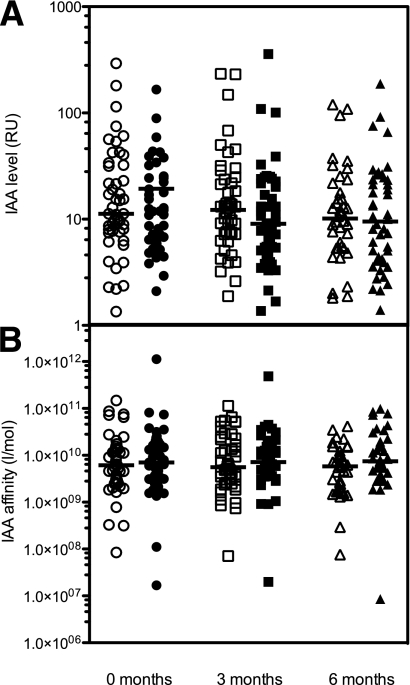
Figure 1.
A: IAA levels in RU. B: IAA affinities in L/mol. The samples drawn before and at ∼3 and 6 months after the start of the intervention are depicted by circles, squares, and triangles, respectively. Open symbols denote children in the placebo group, and filled symbols denote children in the insulin group. Horizontal lines represent medians. Note the logarithmic scale on the y axis.

