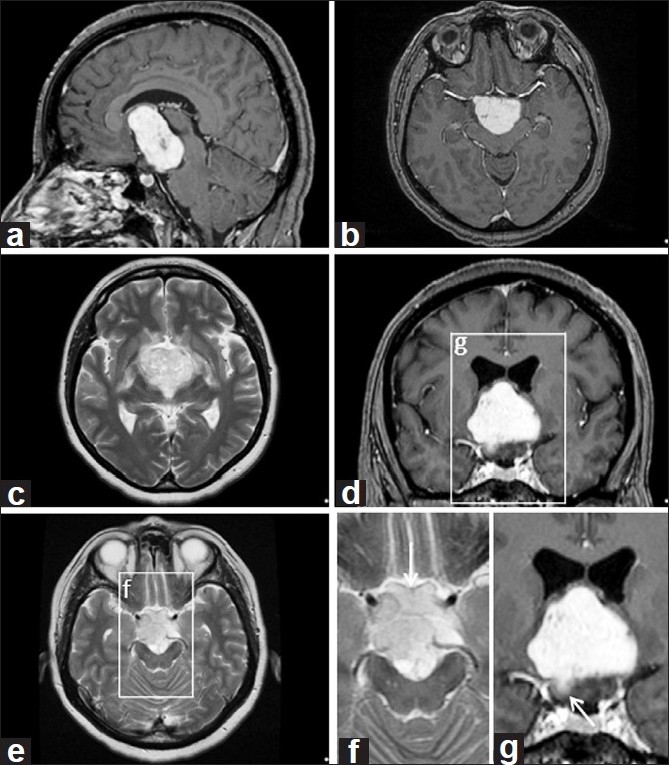
Figure 1.

Sagittal (a) and axial (b) gadolinium enhanced images. (c) T2-weighted axial image. (d) Coronal gadolinium enhanced image. (e) T2-weighted axial image showing involvement of the optic chiasm. (f) High magnification image from (e) revealing hyperintense signal in the optic chiasm (OC). (g) High magnification image from (d) revealing enhancement within the right optic chiasm (Rt OC)
