FIG. 2.
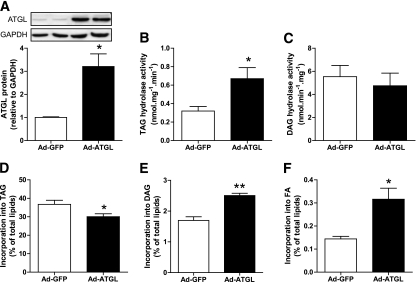
ATGL overexpression increases TAG hydrolysis in myotubes. A: Quantitative bar graph of ATGL protein during adenovirus-mediated ATGL overexpression vs. GFP control (n = 4). Insets are showing representative blots of two independent experiments. TAG hydrolase activity (B) and DAG hydrolase activity (C) were measured in control myotubes (GFP) and myotubes overexpressing ATGL (n = 4). Pulse-chase studies using [1-14C]oleate were performed to determine the kinetics of the different lipid pools in response to ATGL overexpression. The rate of incorporation of radiolabeled oleate into (D) TAG, (E) DAG, and (F) FFA was determined in control myotubes (GFP) and myotubes overexpressing ATGL. *P < 0.05; **P < 0.01 vs. GFP (n = 4).

